Metrics

The Metrics feature helps you to present information in a Charts card on the Portal, such as device temperature. The sequence flow is just the same as that of the States card.
Tutorials
Here is an example of creating the Charts card:
First, send the following v2/notifyPluginUpdate JSON.
{
  "jsonrpc": "2.0",
  "method": "v2/notifyPluginUpdate",
  "params": {
    "sdk": "${OCTO_SDK_VERSION}",
    "appGUID": "${PLUGIN_APP_GUID}",
    "appName": "${PLUGIN_NAME}",
    "epoch": "",
    "displayName": "plugIN Hello",
    "type": "ib",
    "version": "${PLUGIN_VERSION}",
    "modules": [
      {
        "moduleName": "${PLUGIN_NAME}",
        "displayName": "plugIN Hello",
        "properties": [],
        "metrics": [
          {
            "name": "cpu_temperature",
            "displayName": "CPU Temperature",
            "description": "Present CPU Temprature in chart.",
            "displayCategory": "ChartCategory1",
            "displayType": "temperature",
            "displayUnit": "",
            "value": ""
          }
        ]
      }
    ]
  }
}
Once done, Allxon Portal shows the Charts card below. The diagram is empty because it's still in the initialization state.

Now you can send v2/notifyPluginMetric to upload data:
{
  "jsonrpc": "2.0",
  "method": "v2/notifyPluginMetric",
  "params": {
    "appGUID": "${PLUGIN_APP_GUID}",
    "moduleName": "${PLUGIN_NAME}",
    "epoch": "",
    "metrics": [
      {
        "name": "cpu_temperature",
        "value": "298.15"
      }
    ]
  }
}
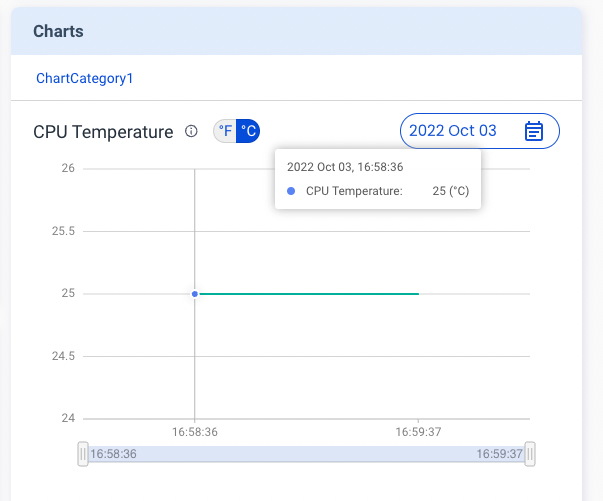
While the "value" is “298.15" in the code line above, why does the Charts card show 25oC ? This is because Allxon Portal uses Kelvin as the unit of temperature if you select "temperature" as the "displayType".
You may curious why "value" is "298.5", because if your "displayType" is set to "temperature", Allxon Portal would assume your "value" unit is Kelvin.
Use this unit converter to make sure you convert correctly between Fahrenheit, Celsius and Kelvin.
Below is an example of the Charts card::
 You can continue to send the
 v2/notifyPluginMetric. The chart is updated accordingly.
Display Type
You can define the unit of the chart or use a predefined temperature scale. For how to set up the unit of a chart, see the following sections.
Temperature
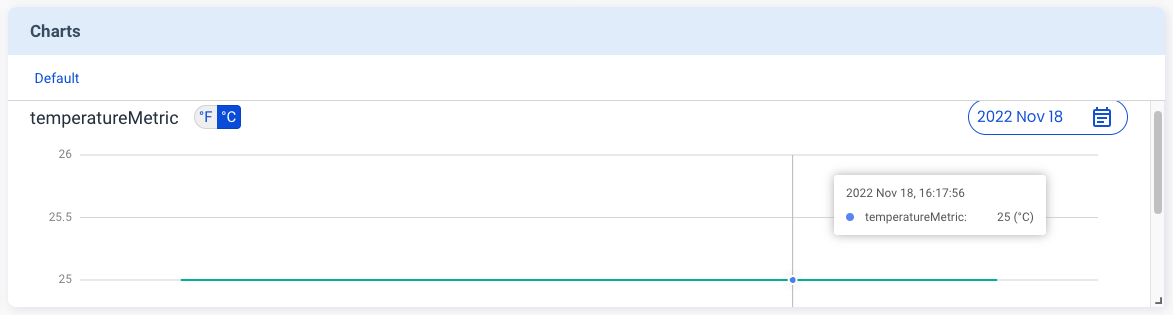
The following example shows the code in v2/notifyPluginUpdate.json for displaying a temperature line graph with a predefined toggle button. The toggle button is used for switching between oF/oC (Fahrenheit/ Celsius).
{
    ...
    "metrics": [
        {
            "name": "temperatureMetric",
            "displayType": "temperature",
            ...
        },
        ...
    ]
}
When v2/notifyPluginMetrics.json is used to update the temperature metric, the "name" must be identical to that in v2/notifyPluginUpdate.json, and the "value" SHOULD be reported in Kelvin.
{
    "jsonrpc": "2.0",
    "method": "v2/notifyPluginMetric",
    "params": {
        ...
        "metrics": [
            {
                "name": "temperatureMetric",
                "value": "298"
            },
            ...
        ]
    }
}
The Portal converts the metric unit from Kelvin to Fahrenheit and Celsius.
Custom
The following example shows the code in v2/notifyPluginUpdate.json for displaying a line graph with a custom unit. You must define "displayUnit" as the unit of the metrics.
{
    ...
    "metrics": [
        {
            "name": "customMetric",
            "displayType": "custom",
            "displayUnit": "degree",
            ...
        },
        ...
    ]
}
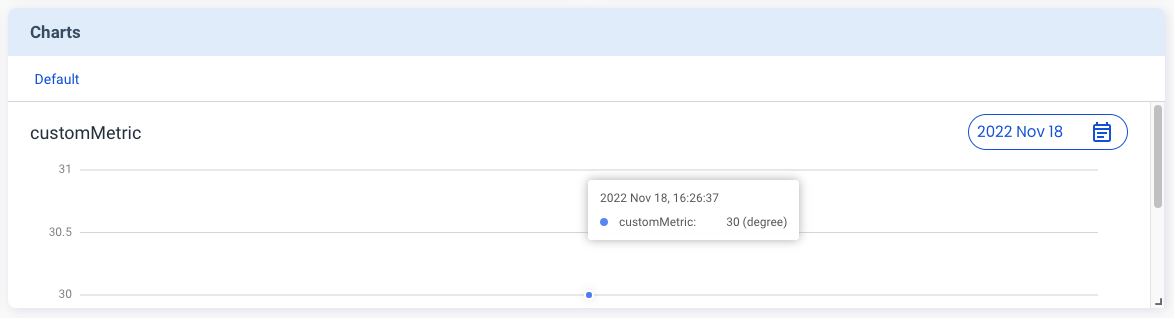
When "v2/notifyPluginMetrics.json" is used to update the metric, the "name" must be identical to that in "v2/notifyPluginUpdate.json", and the data type of "value" must be String.
{
    "jsonrpc": "2.0",
    "method": "v2/notifyPluginMetric",
    "params": {
        ...
        "metrics": [
            {
                "name": "customMetric",
                "value": "30"
            },
            ...
        ]
    }
}
Then the Charts card is updated, as shown below.